Setting up Report Legends
You can configure your reports to include report legends. The information in the report legend is derived from the information properties of the underlying tag that is associated with a pen. If there are no information properties defined for a tag, this information isn't available for a legend.
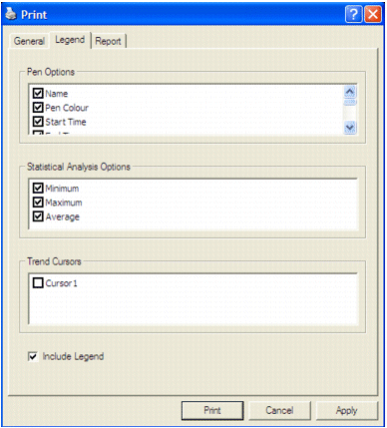
You set up your report legends by using the Legend panel of the Print dialog box.
To set up a report legend:
- In the Print dialog box, click the Legend tab. The Legend panel appears.

- The panel shows, by default, the Pen Options, Statistical Analysis Options, and Cursors lists (if there is a cursor currently displayed on the chart). The options available to you might differ from the ones shown here.
- Select the check box of the Pen Options you want to include in your report. For details about these options, see Configuring the Object View.
- Select the Statistical Analysis Options you want to include. This section is available only if the chart contains at least one analog or digital pen.
- Minimum - causes the minimum value from cache to be returned. Note that this value might not be a real logged sample if the sample found is a multiple calculated sample.
- Maximum - causes the maximum value from cache to be returned. Note that this value might not be a real logged sample if the sample found is a multiple calculated sample.
- Average - uses time-weighted averaging to determine the average for both stepped and interpolated lines. This means that if a trend stays at a value of 10 for 1 hour and then spikes quickly at a value of 50 for a minute, the average will not be significantly affected.
- Select the Cursors you want to include.
- If you want to include a report legend, make sure the Include Legend check box is selected.
- Click Apply.
Published June 2018
