Trend tags allow you to collect data from your I/O device variables for analysis and/or trend graphing.
To add a trend tag:
For a description of the properties, see below.
Trend Tag Properties
Note: If a trend tag was generated by the Equipment Editor, a number of fields on the properties form will be shaded. To configure these fields, you will need to use Equipment Editor (see Using Equipment Editor to Generate Tags).
Field |
Description |
---|---|
Equipment |
The name of the equipment associated with the trend tag. Select a name from the drop-down list of existing equipment definitions, or enter a name. There is a limit of 254 characters across the Equipment and Item Name fields, including any separating periods (.). |
Item Name |
The name of the item with which the trend tag is associated. Items form part of an equipment hierarchy. They can be used to associate tags, alarms and trends with a particular attribute of a physical piece of equipment (see Items). There is a limit of 254 characters across the Equipment and Item Name, including any separating periods (.). Note: When entering an Item Name, there are a number of reserved words that you need to avoid. These reserved words relate to syntax that is used for tag extensions. They are: |
Field |
Description |
||||||||||
---|---|---|---|---|---|---|---|---|---|---|---|
Tag Name |
The name assigned to the trend data (79 characters maximum). If the trend tag is logging a particular variable, use a 16-character name that resembles the 32-character name of the related variable tag. This will mean an association between the two is easily recognizable. The name needs to be unique to the cluster. Trend Tag names need to adhere to the Tag name syntax. If the name is not unique or is not syntactically correct it may not be recognized. If you have many tags, use a naming convention (see Using structured Tag Names). This makes it easier to find and debug your tags. Note: Where Cluster Name is left blank, the name needs to be unique to every defined cluster. Note: Trend tag names have to be unique and not identical to any SPC tag names within the cluster(s) that run this trend. Two tags accessing the same file can result in system errors which may include lost or corrupted trend/SPC data.
|
||||||||||
Cluster Name |
The name of the cluster that runs the trend tag. This field needs to be defined if your project has more than one cluster. You can leave this field blank in a multi-cluster system if cluster replication is enabled (see the parameter |
||||||||||
Type |
The type of trend (32 characters maximum):
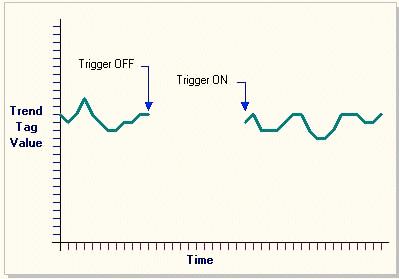
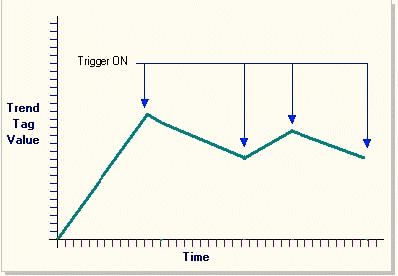
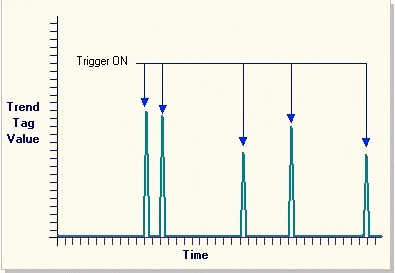
• TRN_PERIODIC - A trend that is sampled continuously at a specified period. You can also define a trigger to stop and start the trend (when a specified condition occurs in the plant). • TRN_PERIODIC_EVENT - A trend that is sampled once each time the value of the trigger changes from FALSE to TRUE. No interpolation occurs between these points, thus providing a graph which spikes at each data point. |
||||||||||
Expression |
The logged value of the trend tag (254 characters maximum). You can log individual variables by using a variable tag. For example:
The value of the process variable LT131 is logged. You can also log any Cicode expression or function, for example:
Note: When a variable tag is used in the expression field of a trend tag property, the Eng Zero Scale and Eng Full Scale fields of that variable tag needs to be set appropriately, or data may be lost because the trend logs negative values are invalid. |
||||||||||
Trigger |
The Cicode expression (or variable tag) that triggers data logging (254 characters maximum). For example:
In this example, logging occurs when the value of the variable tag (LT131) falls below 50. For a periodic trend, data is logged only while the value of the trigger is TRUE. (The trend graph will still scroll, but will display <GATED> where the trigger is FALSE.) In the above example, data is logged continuously while the value of LT131 remains less than 50. Logging ceases when the value rises to (or above) 50. Logging does not occur again until the value of LT131 falls below 50. You do not have to specify a trigger for a periodic trend. If you do not specify a trigger for a periodic trend, logging occurs continuously. For an event trend, data is logged once when the value of the trigger changes from FALSE to TRUE. In the above example, one sample is logged when the value of LT131 first becomes less than 50. Another sample is not logged until the value of LT131 rises to (or above 50) and again falls below 50. |
||||||||||
Sample Period |
The sampling period of the data. You can either enter a period of your own, or choose one from the menu. Enter sampling periods of greater than one second in hh:mm:ss (hours:minutes:seconds) format. If you enter a single digit, without the colon (:), it will be considered a second. For example, if you enter 2, it will be interpreted as 2 seconds. Sampling periods of less than one second needs to be entered as decimals. For example, to enter a period of 200 milliseconds, you would enter 0.2. If the sample period is less than one second, then one second needs to be divisible by the period (to give an integer). For example, a sample period of 0.05 is valid, because 1/0.05 = 20, whereas a sample period of 0.3 is not valid because 1/0.3 = 3.333... . Note:
The Trigger is checked each sample period. If the Trigger is TRUE (or has just changed from FALSE to TRUE, in the case of event trends), the value of the Expression is logged. Examples
The sampling period of the fastest trend on the page is taken as the default value for the display periodDefines the rate at which trend data is displayed on the trend page. of the page. This property is optional. If you do not specify a sample period, the sampling period defaults to 10 seconds. Note: If you edit this property in an existing project, delete the associated trend files before running the new runtime system (For location of the trend files, see File Name). |
||||||||||
Eng Units |
The engineering units of the variable/expression being logged (8 characters maximum). The engineering units are used by the trend scales and trend cursor displays. |
||||||||||
Format |
The format of the variable/expression being logged (11 characters maximum). The format is used by the trend scales and trend cursor displays. This property is optional. If you do not specify a format, the format defined for the associated variable will be used. If the associated variable does not have a format defined, it will default to ####.##. Note: If multiple variable tags are defined in the trend expression and a trend format is not specified, the format will be indeterminate. Under these circumstances, it is recommended that you use this field to specify a trend format. |
||||||||||
Deadband |
A deadband allows the value of a variable tag to fluctuate within a defined threshold without updates being sent through to the trend tag. This may be useful if a tag produces many small, insignificant value changes. The threshold is represented as a percentage of the tag's engineering range. The default value is 0 (zero), which captures every value change. For example, if a tag has an engineering range of zero to 10000, a deadband of 1 would mean a change in value would have to be greater than 100 (or 1 percent of the range) to be recognized. If the current value was 5600, the tag in the PLC would have to change to a value greater than 5700 or less than 5500 before an update would be sent to the trend tag. If an associated variable tag has a deadband setting, it will not automatically apply to a related trend tag. The trend tag deadband should be configured independently. |
||||||||||
Comment |
Any useful comment (254 characters maximum). |
Field |
Description |
---|---|
Zero Scale |
The scaled value that represent the zero point for the trend data (11 characters). |
Full Scale |
The scaled value that represent the full scale point for the trend data (11 characters). |
Field |
Description |
||||||
---|---|---|---|---|---|---|---|
File Name |
The file where the data is to be stored (253 characters maximum). Specify the complete path or use path substitution. When data is collected from your plant floor, it is stored in a file on the hard disk of your computer and used to display a trend or SPC graph (a separate file is used for each trend tag). The File Name property is optional. If you leave this field blank, the trend file is stored in the [DATA] directory (defined by the parameter If required, you can use this field to specify an alternate file name like the following:
In this case, [DATA] specifies the disk and path for the data (as defined by [CtEdit]Data) and "TANK131" is the name specified for the trend file. To specify an alternate directory for the trend file, use a file name like the following:
This would store the trend file in a subdirectory (named "Area1") within the [DATA] directory. Notes:
|
||||||
No. Files |
The number of history files stored on your hard disk (for this tag) (4 characters maximum). The maximum number of files you can specify per trend tag is 999. Performance and storage will be severely impacted by having a large number of history files per trend. By default, 2 history files are stored on your hard disk. |
||||||
Period |
The period of the history file, in hh:mm:ss (32 characters maximum). Alternatively, you can:
If you do not specify a period, the period defaults to Sunday (weekly). When deciding on a period setting, be aware that the performance of a trend viewer (be it the existing Citect SCADA or Process Analyst) may be impacted by the size of a trend file. This is particularly true when displaying event-based trend data. Note: If you edit this property in an existing project, delete or move the associated trend files before you run the new runtime system. (For location of the trend files, see File Name.) |
||||||
Time |
The time of day to synchronize the beginning of the history file, in hh:mm:ss (32 characters maximum). If you do not specify a time, the file is synchronized at 0:00:00 (i.e. midnight). The time needs to be specified in Greenwich Mean Time, not the local time zone. Note: If you edit this property in an existing project, delete the associated trend files - before you run the new runtime system. (For location of the trend files, see the File Name.) |
||||||
Storage Method |
Select Scaled or Floating Point (64 characters). Scaled is a 2-byte data storage method; floating point uses 8 bytes. Floating point storage has a dramatically expanded data range in comparison to scaled storage, allowing values to have far greater resolution. However, you need to consider that it also uses a lot more disk space. Use scaled where compatibility with pre-V5.31 trend history files is necessary. This field cannot be left blank. If you do not specify a storage method, the compiler will generate an error message. Note:
|
Field |
Description |
---|---|
Area |
The area to which the trend data belongs. |
Privilege |
The privilege necessary by an operator to display the trend data on a trend. |
Field |
Description |
---|---|
Historize |
This field enables you to automatically historizeAn object ID associated with every tag in a project that uniquely identifies the tag for use by tag-based drivers, automatically generated at compile. It is used instead of the actual address of the register (which is what most other drivers use to read from and write to I/O devices). and publish the specified trend tag in Schneider Electric's Historian application. If you set this field to "TRUE", the variable will be included in an automated configuration process within the Historian environment. If you set the field to "FALSE" (or leave it blank), the variable will not be included. |
Property |
Description |
---|---|
Project |
The project in which the trend tag is configured. |
See Also
Published June 2018