
The chart view is where Process Analyst pens draw sample values against time. Pens can be grouped in the chart view using one or multiple panes.
The chart view displays a date/time axis at the top of each pane.
A vertical (value) axis my also appear at the left-hand edge of the pane. (The value axis is shown only for analog pens.)
The date/time axis displays time using the current locale format specified in your computer date/time settings. If the millisecond component is necessary, it is appended to the end in the format "<xxx>ms." Since the local time zone is determined from the current computer settings, these settings needs to be configured accurately. The date/time axis will accommodate daylight savings transitions.
Note: In order for the Process Analyst to indicate that Daylight Savings is in effect, the Automatically adjust clock for daylight saving changes option on the Windows™ Date and Time properties needs to be enabled.
The date/time axis can also display data using the universal time coordinate (UTC) format. You can switch between local or UTC time as you like (see Configure Pen Axes).
The date/time axis is divided into major and minor time intervals, which change dynamically depending upon the time span. In the illustration above, the major intervals are 1 minute apart, and the minor are 5 seconds apart.
Note the following:
By default, the date/time axis displays a time span of 10 minutes; the major intervals represent 5 minutes, and the minor intervals 30 seconds.
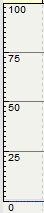
Like the date/time axis, the value axis consists of major and minor intervals, but they represent value intervals rather than date and time. The intervals are calculated automatically by the Process Analyst.
The axis displayed reflects the values for the primary selected pen.
By default the vertical axis will use the engineering scale from the tag of the selected pen. The vertical axis also supports autoscaling. When autoscaling is enabled, the vertical axis automatically adjusts its limits to accommodate new samples as they are added to each individual pen.
You can scroll and scale the vertical axis; for details, see Scroll the Chart and Scale the Chart. You can also configure the appearance of the vertical axis; for details, see Configure Pen Axes.
The Now Indicator is a small white circle on the date/time axis that indicates the current time based on the computer's time settings.
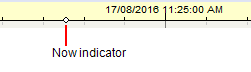
The position of the Now indicator is refreshed according to the value specified in the Display Refresh Date field in the Process Analyst Control Properties dialog box. See Also Synchronize to Now.
Process Analyst pens also use gridlines as a visual guide to help an operator determine the value of trends. Major gridlines are solid lines; minor gridlines are dashed lines. Analog pens have vertical and horizontal gridlines; alarm and digital pens only have vertical gridlines. The display of gridlines changes dynamically according to the selected time span. See Configure Pen Gridlines.
Published June 2018