Process Analyst pens draw sample values against time. Each pen has its own colored line in the chart view (and can contain other graphical elements).
Sample markers (or points) are drawn on the line to indicate where data was recorded in the archive. The style of the line indicates the quality of the data (see Data Quality). The style of the sample marker indicates the compaction of the sample (see Data Compaction).
The Process Analyst supports three types of pen:
The Process Analyst control typically uses analog pens to represent variable or numerical data. Only analog pens have a value (vertical) axis, which the data is plotted against.
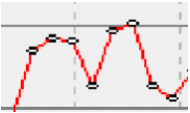
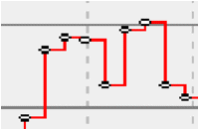
Analog pens have two types of interpolation that allow you to specify how to connect data samples on a trend line:
See Also Interpolated Samples.
The Process Analyst control typically uses digital pens to represent binary data. Values on the pen are restricted to 0 or 1. Any value equal to or greater than 0.5 is set to 1; other values are set to 0. A fill color is used to indicate where the data is 1, as shown here:
By default, the layout of digital pens is stacked. For details, see Pen Layout.
The Process Analyst uses alarm pens to graphically display the history of Citect SCADA alarms over time. The alarm's on/off transition state changes and acknowledgment are represented graphically in the alarm pen display.
When an alarm is on, it is represented by a bar filled with color. The color indicates different states. The line above represents operator acknowledgment of the alarm.
The diagram below illustrates how an alarm pen displays the information of an alarm tag:
The Process Analyst allows the appearance of pens to be configured during run time and design time. You can configure the line color, width, and fill color. For details, see:
Note: To configure default appearance settings for a particular type of pen, go to the Process Analyst Properties dialog and select the pen type in the property tree under Default Settings.
See Also
Published June 2018