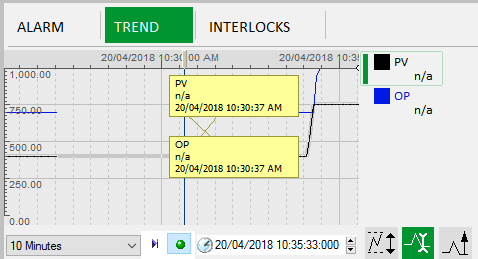
The Trend tab displays a graphical view of data associated with the object that is currently in context. This is presented using a compact version of Citect SCADA's Process Analyst.
The chart view displays data for the selected object using a set of pens that are color-coded and listed to the right of the chart. Each pen draws sample values against time. By default, the view will show the first five trends in alphabetical order by tag name.
Pens can be configured in one of the following ways:
Note: The value of these parameters is a comma-separated list of equipment item names
The following display commands are available from the navigation bar that runs along the bottom of the chart view.
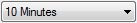
The Span Picker contains commonly used predefined time spans that you can select from a drop-down menu. The time span of the trend display represents the difference between the start of the chart and the end time. Selecting a time span adjusts the start time and leaves the end time as it is.

The Synchronize to Now command synchronizes every pen such that the date/time reflects "Now", which is positioned on the right edge of the chart. "Now" is calculated using the current system time.

When Autoscroll is turned on, as time passes the position of the pens moves by the same amount to keep pace. By default, the display is updated every second. When Autoscroll is turned off, as time passes the position in time of pens remain fixed.
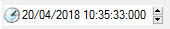
You can use the End Date/Time Picker to specify an end time for the chart view. You can type in a date or time explicitly, or you can use the up/down arrow buttons to increment or decrement the value respectively.
You can also use the following command buttons:

This command allows you to edit the vertical scale of a selected analog pen. It opens a dialog that allows you to enter new minimum and maximum values for Limits or Engineering Scale. The Engineering Scale values are obtained from the source tag.
Note: The engineering scale is used by default.

A cursor allows you to determine the value of a pen at a given point in time by dragging the cursor to a specific point on the pen line. A cursor label is used to display the value. This button allows you to toggle the cursor on and off.

This button opens the Default Trend page in the main display area, allowing you to view the current trend chart on a larger scale.
Note: If you have navigated to the default Trend page using this button and you return to the graphic page and click the Back button, the graphic page that you browsed to last will be displayed (instead of the Trend page).
See Also
Published June 2018