A project created using the Situational Awareness Starter Project will include a default trend page that is accessible from the runtime Header Bar. Click on the icon below to display a trend page in the page content area (see Default Layout).
![]()
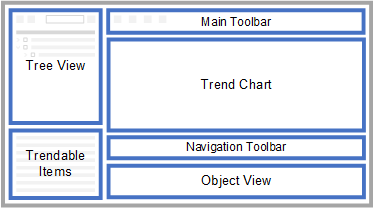
The default trend page allows you to analyze specific trends and alarms for equipment. The layout of the default trend page features the following sections:

Behaviors that you will observe when you navigate between pages include:
Note: You can launch the trend page from other pages using the buttons in the Information Zone's Trend tab. This will launch the trend page with the trend for the object selected on that page.
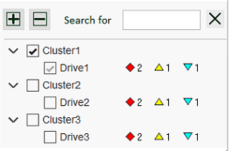
The tree view provides a hierarchical view of a project’s equipment hierarchy.

The tree view displays:
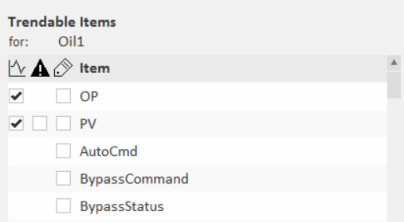
The Trendable Items section lists the items associated with each piece of equipment that can be trended.

The following icons indicate the type of an item (tag) - an Alarm, Trend or Instant (Variable). A check box each is displayed for each applicable type.
|
|
Trend Items |
|
|
Alarm Items |
|
|
Instant Items |
Select the required check boxes to add them to the chart. Up to 16 trends can be added. When the limit is reached, the check boxes are hidden.
Displays the trend chart based on the selected equipment and options.
The Main toolbar is located above the chart. It contains commands that allow you to perform general operations, such as save and open views, print reports, and so on. The table below describes the buttons that are included on the main toolbar.
|
Item |
Description |
|---|---|
|
|
Load View. Loads a saved view from file. For details, see Loading a view. |
|
|
Save View. Stores a view to file. For details, see Saving a view. |
|
|
Print. Displays the standard Windows Print dialog box for printing trend reports. For details, see Printing and Exporting. |
|
|
Copy to Clipboard. Copies visible pens to the Windows Clipboard. For details, see Copying data to the Clipboard. |
|
|
Copy to File. Exports visible pens to an Excel-compatible file. For details, see Copying data to file. |
|
|
Add Pen. Displays the Add New Pen(s) dialog box for adding a pen. For details, see Adding Pens. Note: Pens added with this button will not be synchronized with the equipment tree and trendable items list. |
|
|
Remove Pen. Deletes the currently selected pen from the trend display. For details, see Deleting Pens. |

|
Remove All Pens. Deletes the currently displayed pens from the trend display. |
|
|
Lock/Unlock Pens. Toggles the locking of pens. For details, see Locking/Unlocking Pens. |
|
|
Show/Hide Points. Toggles the display of points representing where sample data was recorded in the archive. For details, see Pens. |
|
|
Show/Hide Cursors. Toggles the display of cursors. For details, see Using Cursors. |
|
|
Show/Hide Cursor Labels. Toggles the display of cursor labels. For details, see Using Cursor Labels. |
|
|
Find in Model. Locates the equipment for the currently selected pen in the equipment tree. |
The Navigation toolbar contains commands to allow you to navigate forward or backward through trends, as well as other navigation-related tasks.

A Start Time Picker is located on the left-hand side of the navigation toolbar, an End Time Picker is located on the right. You can use these to Specify a Start Time and End Time. If a time picker control is using Daylight Savings time, the clock to the left of the control will have a shaded segment.

The Span Picker contains commonly used predefined time spans that you can select from a drop-down menu. The time span of the trend display represents the difference between the start time and the end time. Selecting a time span adjusts the start time and leaves the end time as it is. To set a time span that is not included in the list of predefined times, see Set a Nonstandard Time Span. See Also Lock the Time Span.
The Navigation toolbar also includes a set of command buttons. You can use these buttons to perform the following tasks:
The Object View displays the list of objects (equipment) displayed in the trend chart along with properties of the pens such as name, color, scale and so on. The following properties are displayed:
| Column | Description |
|---|---|
|
Scale |
Vertical axis start and end position of the pen. |
|
Engineering Units |
Engineering units associated with the pen. |
|
Comment |
The trend/alarm comment defined for the pen. |
|
Alarm Name |
Name of associated alarm tag. |
|
Cluster |
Name of the cluster in which the object is defined. |
|
Error |
Displays the error of the last data request. Blank if last data request succeeded. |
See Also
Published June 2018