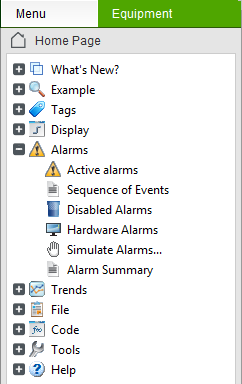
Alarm pages present a list of alarms to an operator. There are different types of alarm pages, each designed to suit a specific purpose. For example, an alarm page may only display alarms that are currently active, or it may include a historical summary of all alarms that have occurred.
Viewing alarm pages at runtime varies according to the templates used to create the alarm pages. For example, if your project uses the StruxureWare templates the Alarm pages are automatically included in the runtime system available from the list of alarm pages in the Menu panel.

If your project is based on a Tab Style starter project, you can access the Alarms page at runtime via the Alarms tab.

The following alarm pages will be available at runtime:
The Active Alarms page displays all alarms that are unacknowledged, or acknowledged and still in an alarm state.
The active state of a digital alarm is ON, while the active state of an analog alarm varies, depending on how the alarm is configured. For example, the alarm state could be HIGH, LOW LOW, or so on.
By default, the following columns are displayed:
You can also include additional columns that display information such as specific alarm property values or quality flags (see Add a Column to an Alarms List).
When an alarm is selected, you can perform the following actions:
The Hardware Alarms page displays a list of any hardware alarms that are unacknowledged, or acknowledged and still in alarm state.
The following columns are displayed:
When a hardware alarm is selected, you can perform the following actions:
The Disabled Alarms page displays a list of alarms that are disabled in the system for reasons such as a maintenance shutdown.
By default, the following columns are displayed:
You can also include additional columns that display information such as specific alarm property values or quality flags (see Add a Column to an Alarms List).
When an alarm is selected, you can perform the following actions:
The Alarm Summary page displays a historical log of alarms that you can use for long term analysis and troubleshooting. It displays the date and time each alarm reached ON state and OFF state.
Note: The alarm summary includes historical data, which means you should manually refresh the page to view the latest events before you analyze the data it includes.
By default, the following columns are displayed:
You can also include additional columns that display information such as specific alarm property values or quality flags (see Add a Column to an Alarms List).
When an alarm is selected, you can perform the following actions:
The Sequence of Events (SOE) page displays a historical view of all system events that have occurred. In the case of alarms, an event is logged when an alarm changes state, or when an alarm is enabled or disabled.
By default, the following columns are displayed:
You can also include additional columns that display information such as specific alarm property values or quality flags (see Add a Column to an Alarms List).
Note: You can only use the Date, Time and Milliseconds columns to sort the SOE page (see Sort Alarms).
When an event is selected, you can perform the following actions:
Information included on the alarm pages is presented in a table. This allows you to make simple runtime changes to the page, as you can adjust, rearrange and remove columns (see Add a Column to an Alarms List).
Each alarm page supports a variety of built in features that an operator can use at runtime. For example, if you used a starter project an operator will be able to perform the following tasks:
For more information, see Action Alarms at Runtime.
See Also
Published June 2018